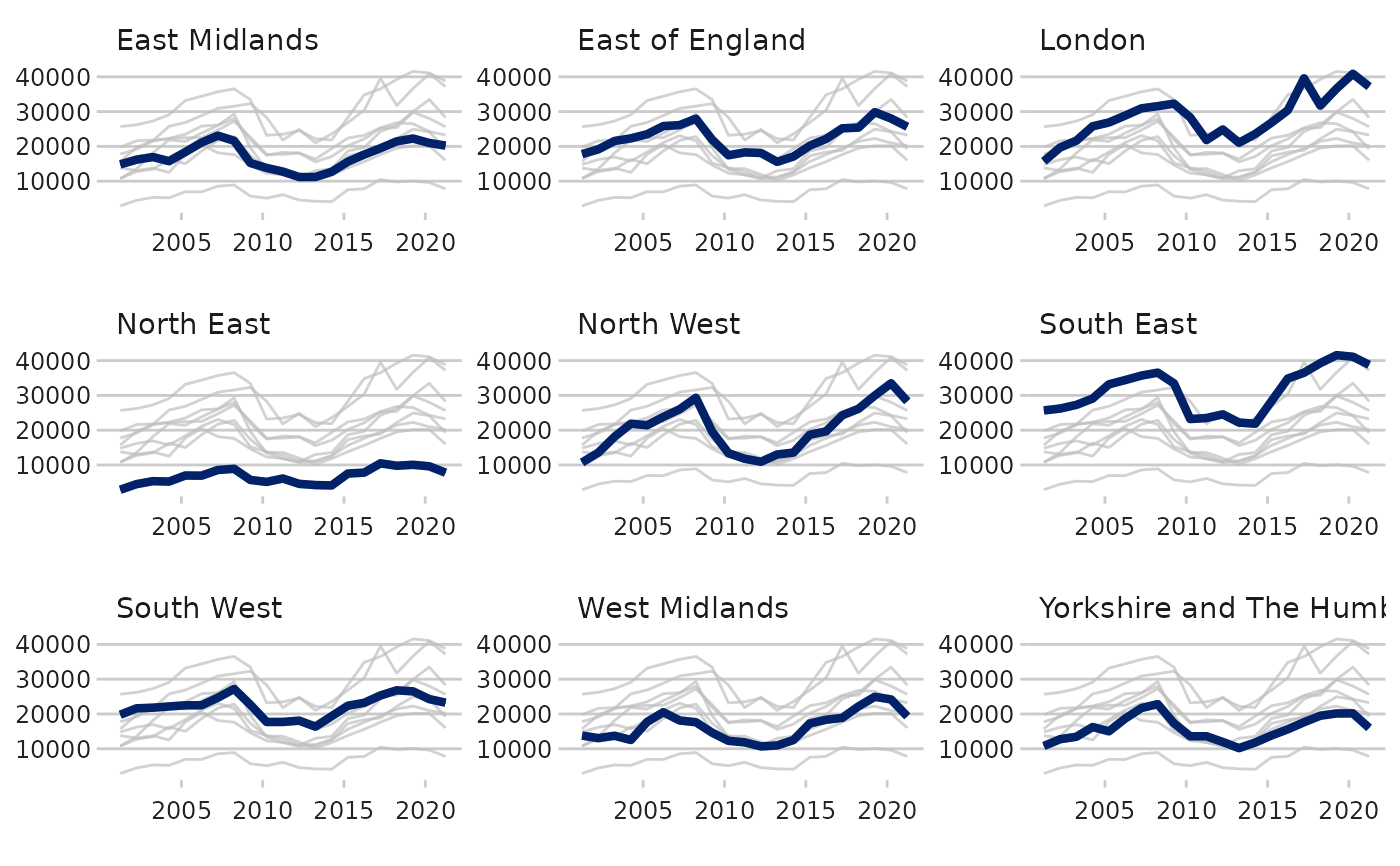
Highlighted faceted graphs in the dluhc style
facet_highlight_timeseries.RdHighlighted faceted graphs in the dluhc style
Usage
facet_highlight_timeseries(
  .data,
  datecol,
  ycol,
  groupcol,
  textsize = 1,
  dateformat = "%Y-%m-%d"
)
Arguments
- .data
The dataframe used for the analysis, ideally a 3 column dataframe
- datecol
The column name which has the date variables in. Date needs to be in one of three formats: "2021-01-23", "23/01/2021" or "21-Jan-2021"
- ycol
The column name which has the numeric values, ensure these are in numeric format
- groupcol
The column name which will split the data into individual graphs
- textsize
A numeric variable for text size, this isnt the actual text size, but will scale the text size in the facets correctly
- dateformat
The format which the date is presented in using the standard R date format, see here for more detail https://www.statology.org/r-date-format/