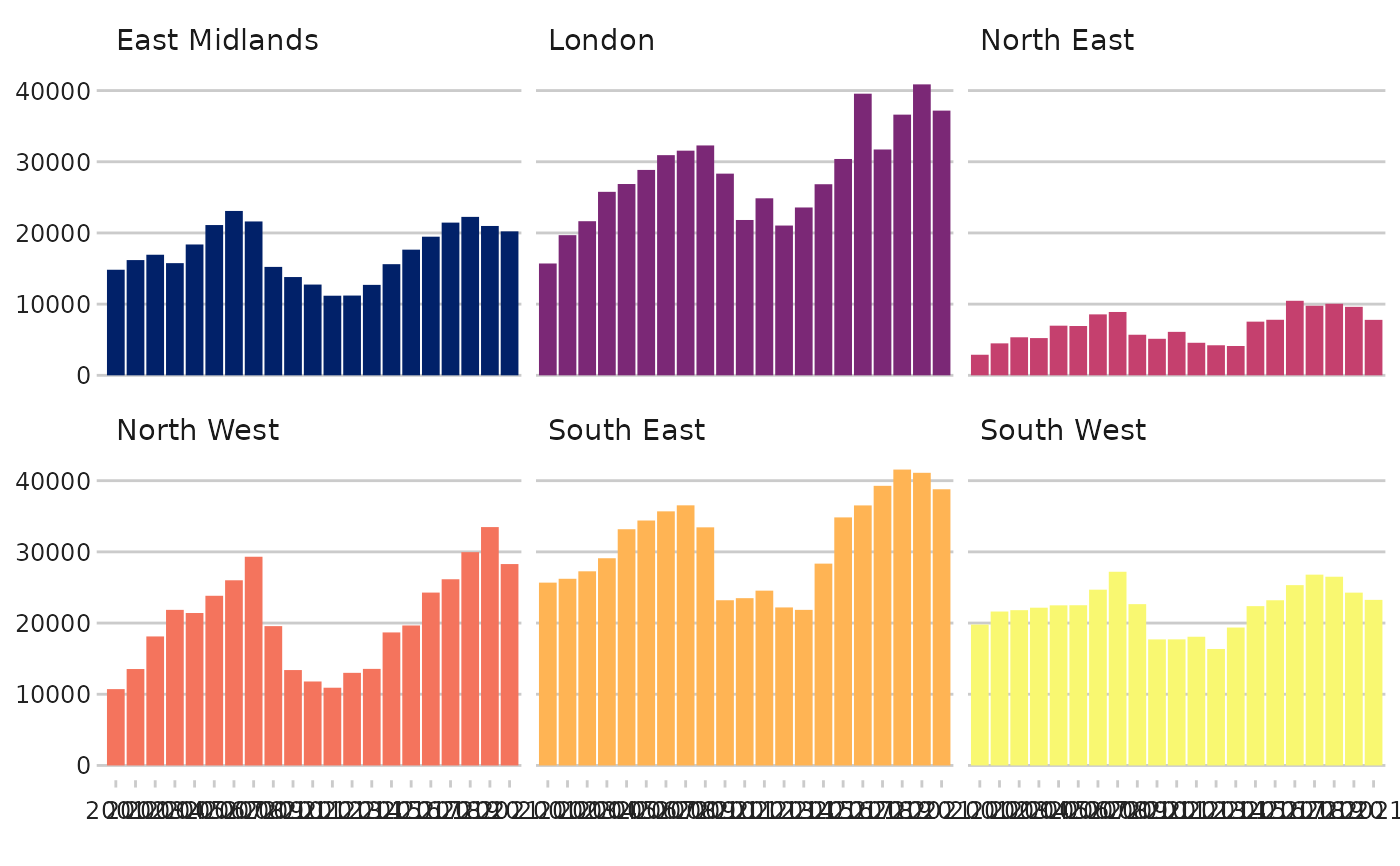
Title
facet_barchart.RdTitle
Arguments
- .data
A dataframe containing your data, ideally a 3 column dataframe with one value column and two categorical columns
- xcol
The column which contains the variable to go on the x axis of the column chart
- ycol
The column which contains the value to go on the y axis
- groupcol
The column which contains the categorical variable which the graphs will be faceted by
- textsize
The text size, initially set to 1, the size is a ratio to the normal dluhc_style size of 2
- diffcolours
A TRUE/FALSE variable which determines if you want each of the charts to have the same colour, or for each graph to have one of the six colours from the DLUHC theme. If you want neither of these options, this can be overridden with the scale_fill_manual() ggplot function.
