Create a standard theme map from an sf object
LA_map.RdCreate a standard theme map from an sf object
Usage
LA_map(
  .data,
  variable,
  LA_col,
  map_colours = c("#FFFFFF", "#012169"),
  year = "2021-22",
  countries = "E",
  save = FALSE,
  filepath = NULL
)
Arguments
- .data
An sf object which has data broken down by local authority. This function only works for data in local authority breakdown only.
- variable
The column in the .data which has the numeric value to be mapped
- LA_col
The column which contains the Local Authority code
- map_colours
The colour which you want to represent the low and high values, must be in vector form
- year
The financial year which the LA codes you are using relate to, given in quotations
- countries
The countries which you wish to appear on the map. These are E, E+W, GB and UK for England, England+Wales, Great Britain and United Kingdom respectively
- save
A TRUE/FALSE statement if you want the file to be exported as a png file. If TRUE, the filepath must be defined
- filepath
If save is TRUE, filepath is the save location of the png output must be in the form of quotations
Examples
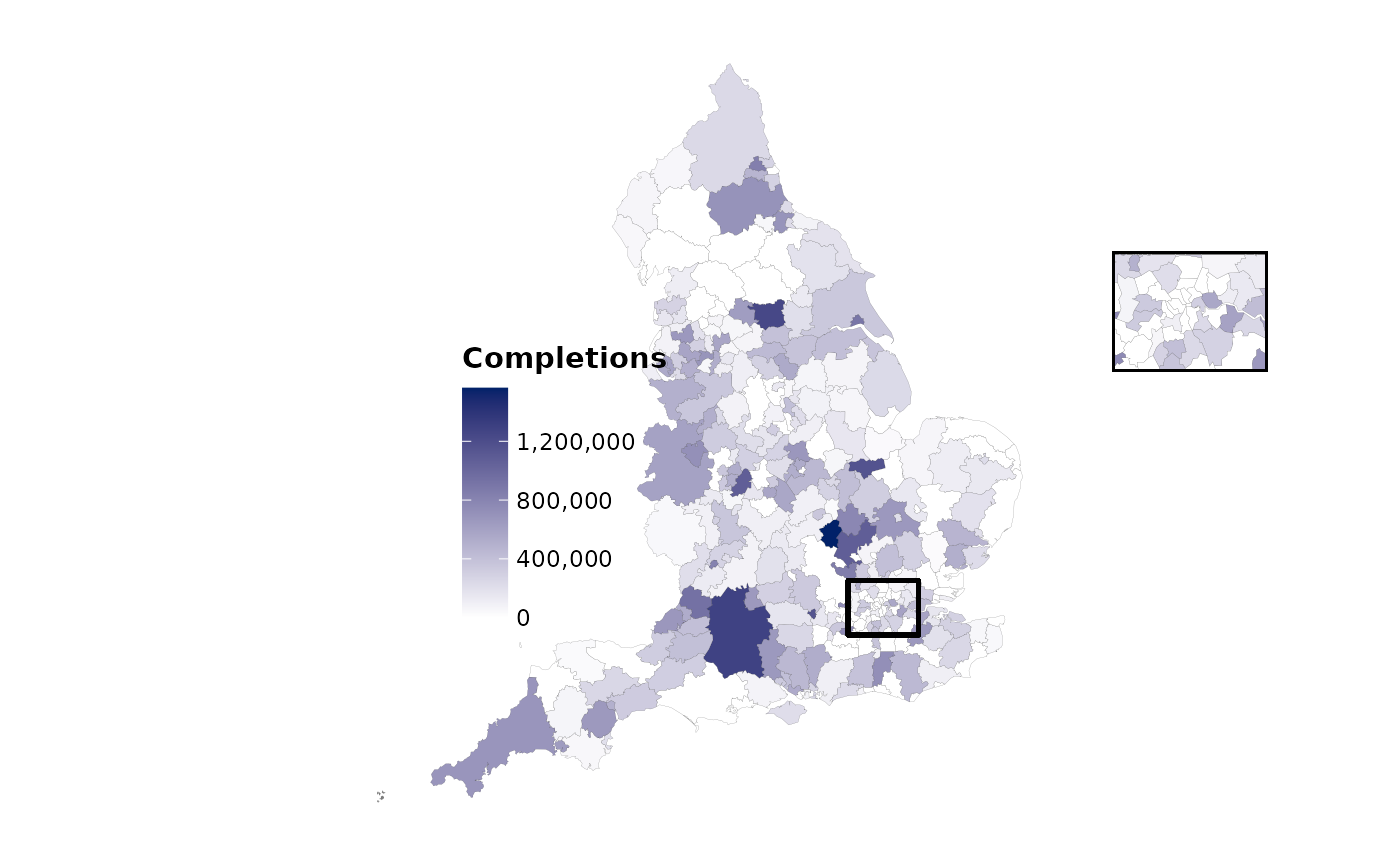
df <- dluhctheme::Help_to_Buy
LA_map(df,variable = Completions,LA_col = LA_Code,year = "2020-21",countries = "E",save = FALSE)
#> [1] "Your original data had 334 rows of data"
#> [1] "On the map, there were 314 matches, from 314 LAs on the map"